Walkability in the US
Analyzing the National Walkability Index Database
2023.04.28 - by Rafi Gil Diaz
It’s no secret that the United States suffers from a “car culture”. Metropolitan areas are crowded with parking lots larger than the buildings they were constructed for and wide streets to accommodate heavy traffic. The US highway network spans over 4 million miles, and an estimated 3.17 trillion vehicle-miles were driven in 2022 alone.
When compared with other major countries around the world, it becomes apparent just how much more Americans drive: in 2017, 4.1 million passenger-miles (distance of trip × number of passengers) were traveled in the US: over 2x more than Japan, Great Britain, and Australia combined (OECD).
The National Walkability Index
In an attempt to promote smarter cities, the US Environmental Protection Agency has worked to find an objective measure of walkability. In an earlier project, the agency put together the Smart Location Database (SLD), which “is a nationwide geographic data resource for measuring location efficiency” (EPA). The National Walkability Index Dataset is builds on this, aggregating and transforming data from the SLD to consider the factors they found to be most important to a city’s walkability.
In loose terms, walkability might be defined as “an average person’s willingness to choose walking over any other mode of transportation”. As the EPA says, “Walkability depends upon characteristics of the built environment that influence the likelihood of walking being used as a mode of travel” (data.gov).
To calculate a Walkability Index for each region tracked in the SLD, the EPA team considered four main factors:
- 8-tier employment entropy - Employment is divided into 8 categories: retail, office, service, industrial, entertainment, education, healthcare, and public administration (EPA). Higher entropy means there is a greater mix of job categories.
- Employment and household entropy - Similar to the 8-tier employment entropy category, employment and household entropy considers the mix of residential and commercial areas in a location.
- Street intersection density - The relative density of intersections for any area.
- Distance from the population-weighted centroid of an area to the nearest transit stop - For any given area, the population-weighted centroid can be thought of as a sort of “center of mass”. This category measures the distance from that point to the nearest transit stop (bus, train, etc.).
In general, a city that is high in 8-tier employment entropy, employment and household entropy, and street intersection density will be more walkable than a city low in those factors. A city with a lower distance from the population-weighted centroid of an area to the nearest transit stop will likely be more walkable than a city with a higher distance.
I hope this dashboard helps to illustrate the relationships between these different factors and helps to demonstrate the trends mentioned above.
It seems like some of the tooltips break when this site is in dark mode. Use the sun/moon button at the top of the page to switch the theme if you can’t read the CBSA Name in the tooltips for the second and third graphs. I tried fixing this with Altair, which was used to generate the visualizations, but it seems to be a problem with the way tooltips are rendered, not with any setting that can be changed.
Other Research About Walkability
While the National Walkability Index has been made available for public use, it has also been used internally by the US government groups for studies or other projects. One such project is the CDC’s 2020 study, Associations between the National Walkability Index and walking among US Adults.
Associations between the National Walkability Index and walking among US Adults

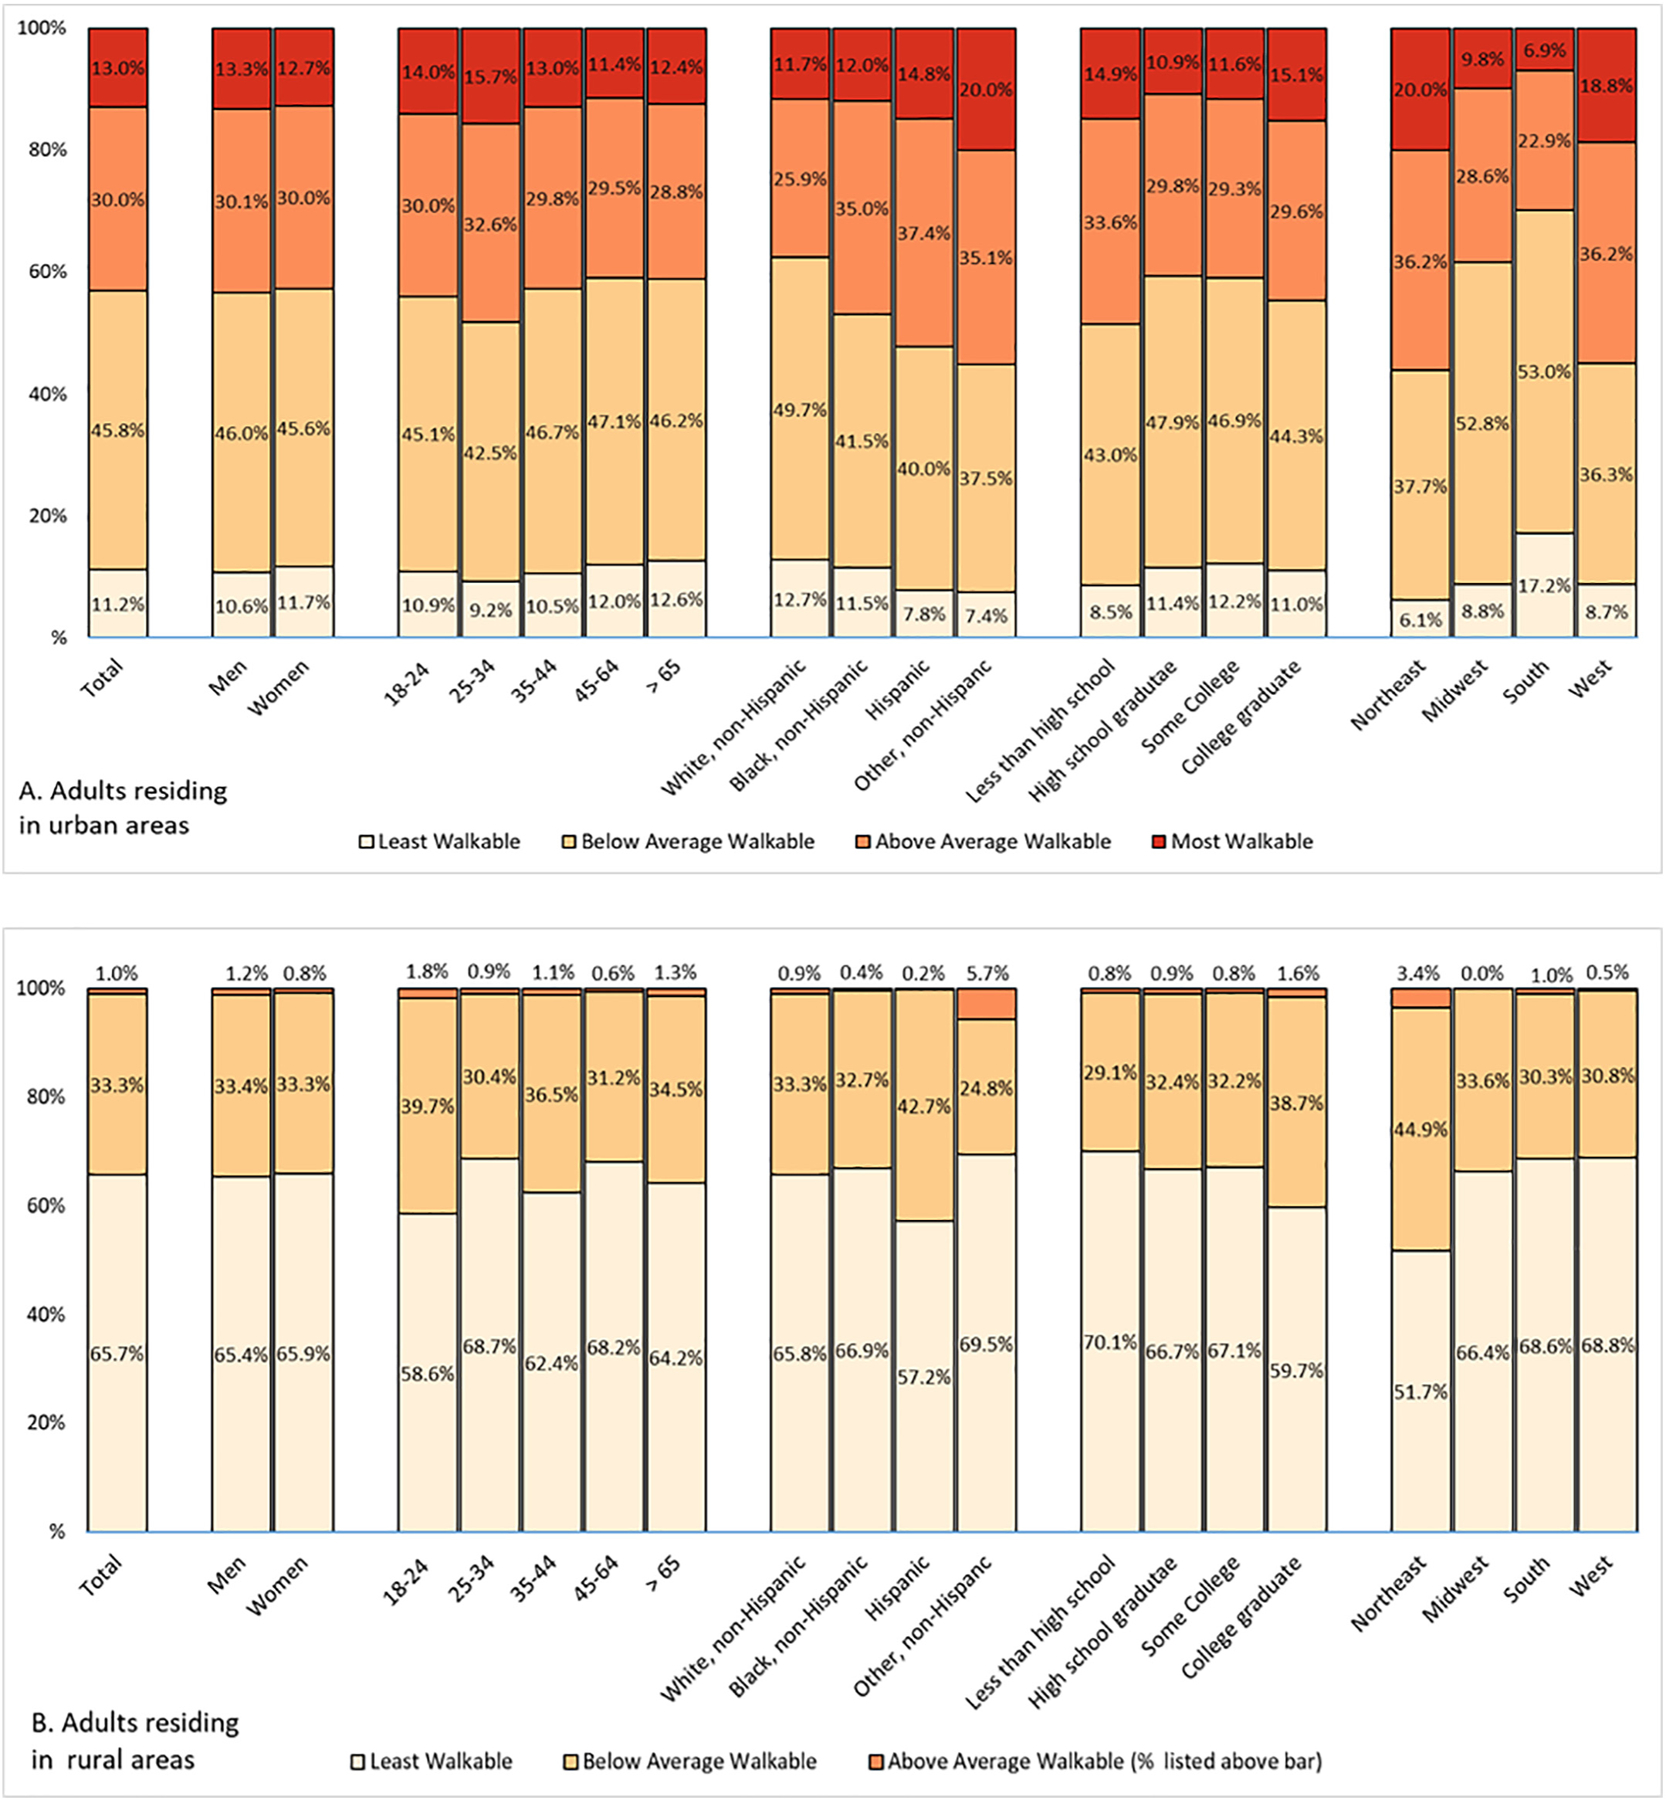
This study worked to correlate the data gathered from the EPA’s Walkability Index with information about walking habits from the 2015 National Health Interview Survey. I believe the above visualization does a good job of summarizing their work, showing where different categorizations of people are more likely to live. As you might guess, urban areas contain more walkable locations (this is in part due to the way Walkability is measured, described above). It also seems like the Northeast contains the highest percentage of highly walkable areas, for both rural and urban locations.
More Information
Explore the data on your own!